
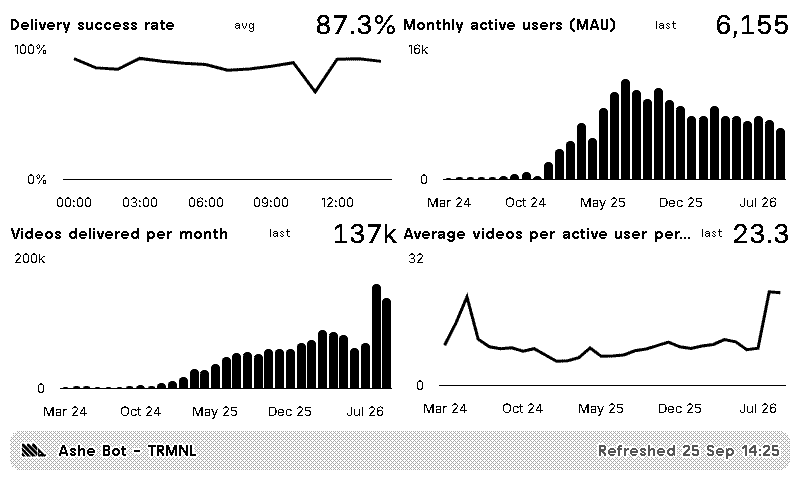
Fits a full screen or a corner of a mashup
Every view keeps the dashboard's tile order. Charts follow the dashboard's own date range and filters, reduced to at most 40 points and four series.
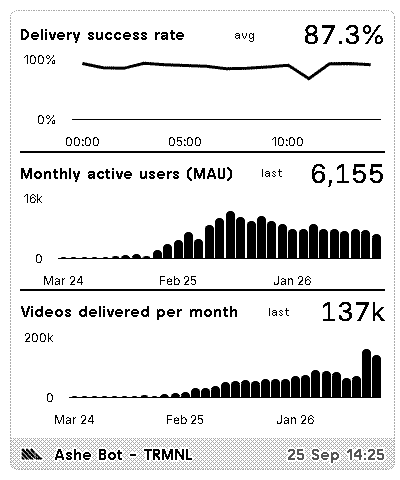
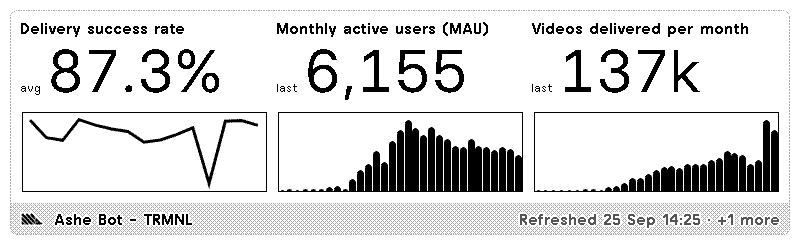
- Full
- The first two dashboard rows of the page, up to six tiles, in the dashboard's own arrangement.
- Half views
- The first three tiles. Horizontal turns charts into sparklines; vertical stacks them.
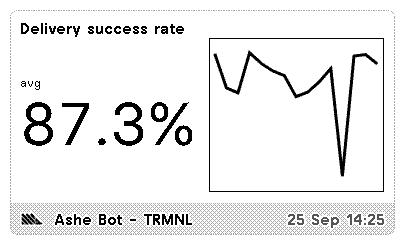
- Quadrant
- The first number tile on the page, or the first tile when there is none.
Four steps, about two minutes
You need a TRMNL device and a PostHog Cloud account that can open the dashboard you want to show.
-
Install the recipe
In TRMNL, open Plugins, find Dashboards for PostHog in the recipe catalog (or open the recipe page) and click Install.
-
Connect PostHog
Click Connect PostHog, sign in, pick the organization and project, and approve read access to dashboards, insights and queries.
-
Paste the dashboard URL
Open the dashboard in PostHog and copy the address bar into Dashboard URL. The plugin reads three things from it. Pick the same project on the PostHog consent screen, because the project in the URL is the one that is read.
Regionhttps://eu.posthog.com Project/project/12345 Dashboard/dashboard/67890 -
Save and add it to a playlist
The dashboard appears on the device at its next refresh. The plugin fetches every 15 minutes and asks PostHog to recalculate each insight on every fetch.
| Setting | Default | What it does |
|---|---|---|
| Dashboard URL | required | The PostHog dashboard to mirror. Query strings and anchors are ignored. |
| Page | 1 | Each page is the next six tiles. To show tiles 7 to 12, add a second instance with page 2. |
| Show dashboard description | Hide | Prints the dashboard description under the title on the full view. |
| Tile 1 to 6 headline | Average | For a time-series chart in that position, show the average of its points or the last point. The last point can be a period still in progress. Number tiles keep PostHog's value. |
Trends insights, drawn for e-ink
Drawn on the device
- Bold number
- Line
- Cumulative line
- Bar
- Stacked bar
- Horizontal bar
- Pie, as a donut
A bold number shows the change against the previous period when the insight compares periods. Pies keep the top five slices plus Other.
Shown as a named placeholder
- Funnels
- Retention
- Paths
- Lifecycle
- Stickiness
- SQL and tables
- Web analytics
- Error tracking
The tile keeps its place with the insight name and a hint to open it in PostHog. Text tiles are skipped and do not count towards the six.
Reading the title bar
If the screen shows a message
Your data goes from PostHog to TRMNL, and nowhere else
Privacy
dashboard:readinsight:readquery:read- The author runs no server and never sees your dashboards or tokens. This site only hosts this page and the OAuth client description PostHog reads during sign-in.
- Each installer connects their own PostHog account. TRMNL stores and refreshes the tokens.
- Revoke access at any time in PostHog under account settings, Connected applications.
Limitations
- One dashboard per plugin instance, six tiles per page, four pages.
- No date range or filter override: charts use the dashboard's own.
- A dashboard that has not been opened in a while may show cached values on the first refresh and catch up on the next one.
- PostHog Cloud only. Self-hosted instances are not supported.